
Turn fuel data into operational intelligence.
OptiFuel brings fuel consumption, spend, card activity, forecasting, reporting and operational controls into one platform.
Built for organisations managing fuel across fleets, locations, drivers and cost centres, it turns transaction data into information teams can actually use.
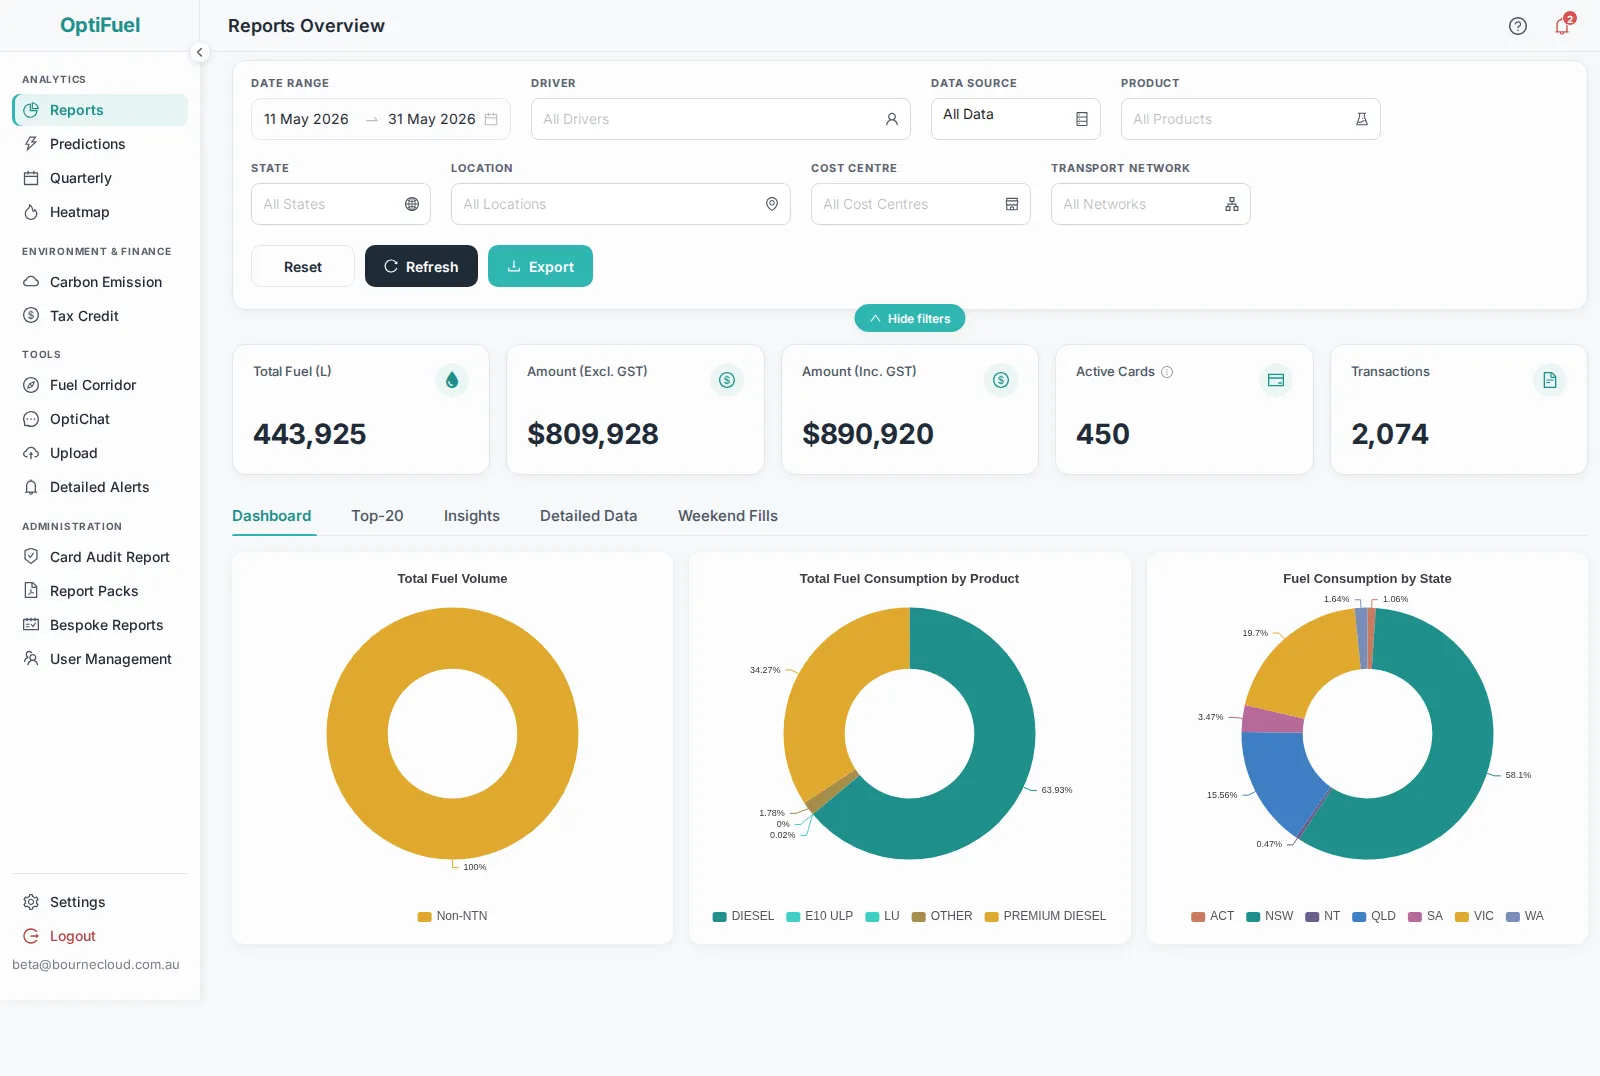
See the whole fuel operation in one place.
OptiFuel brings fuel volume, spend, card activity and transaction data together in a single reporting environment.
Filters let users move from an organisation wide view into specific states, locations, drivers, cost centres, products and transport networks.
The result is a consistent view of operational fuel performance without relying on separate spreadsheets and manual reporting.
- Fuel volume
- Fuel spend
- Active cards
- Transactions
- Product mix
- State analysis
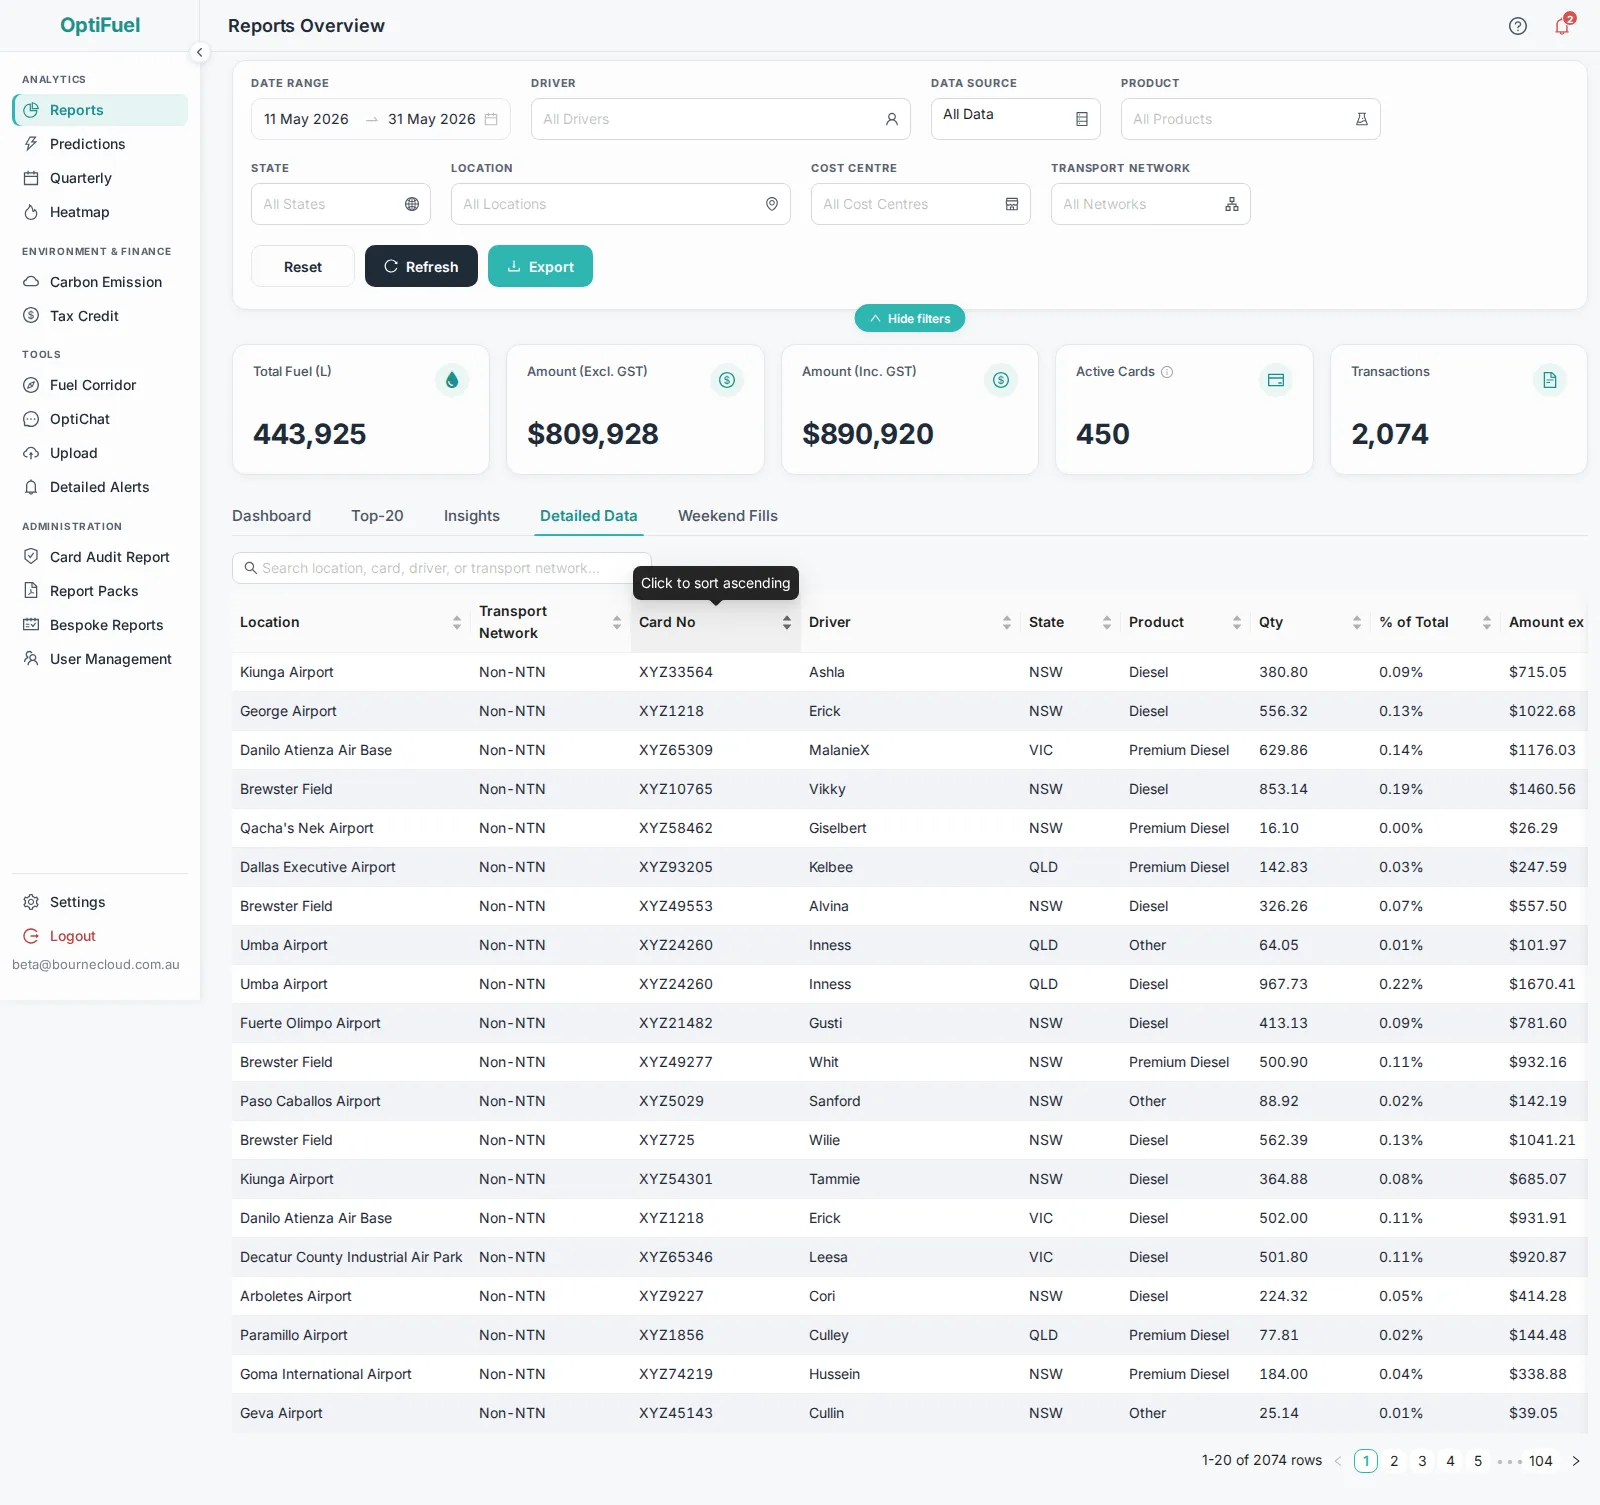
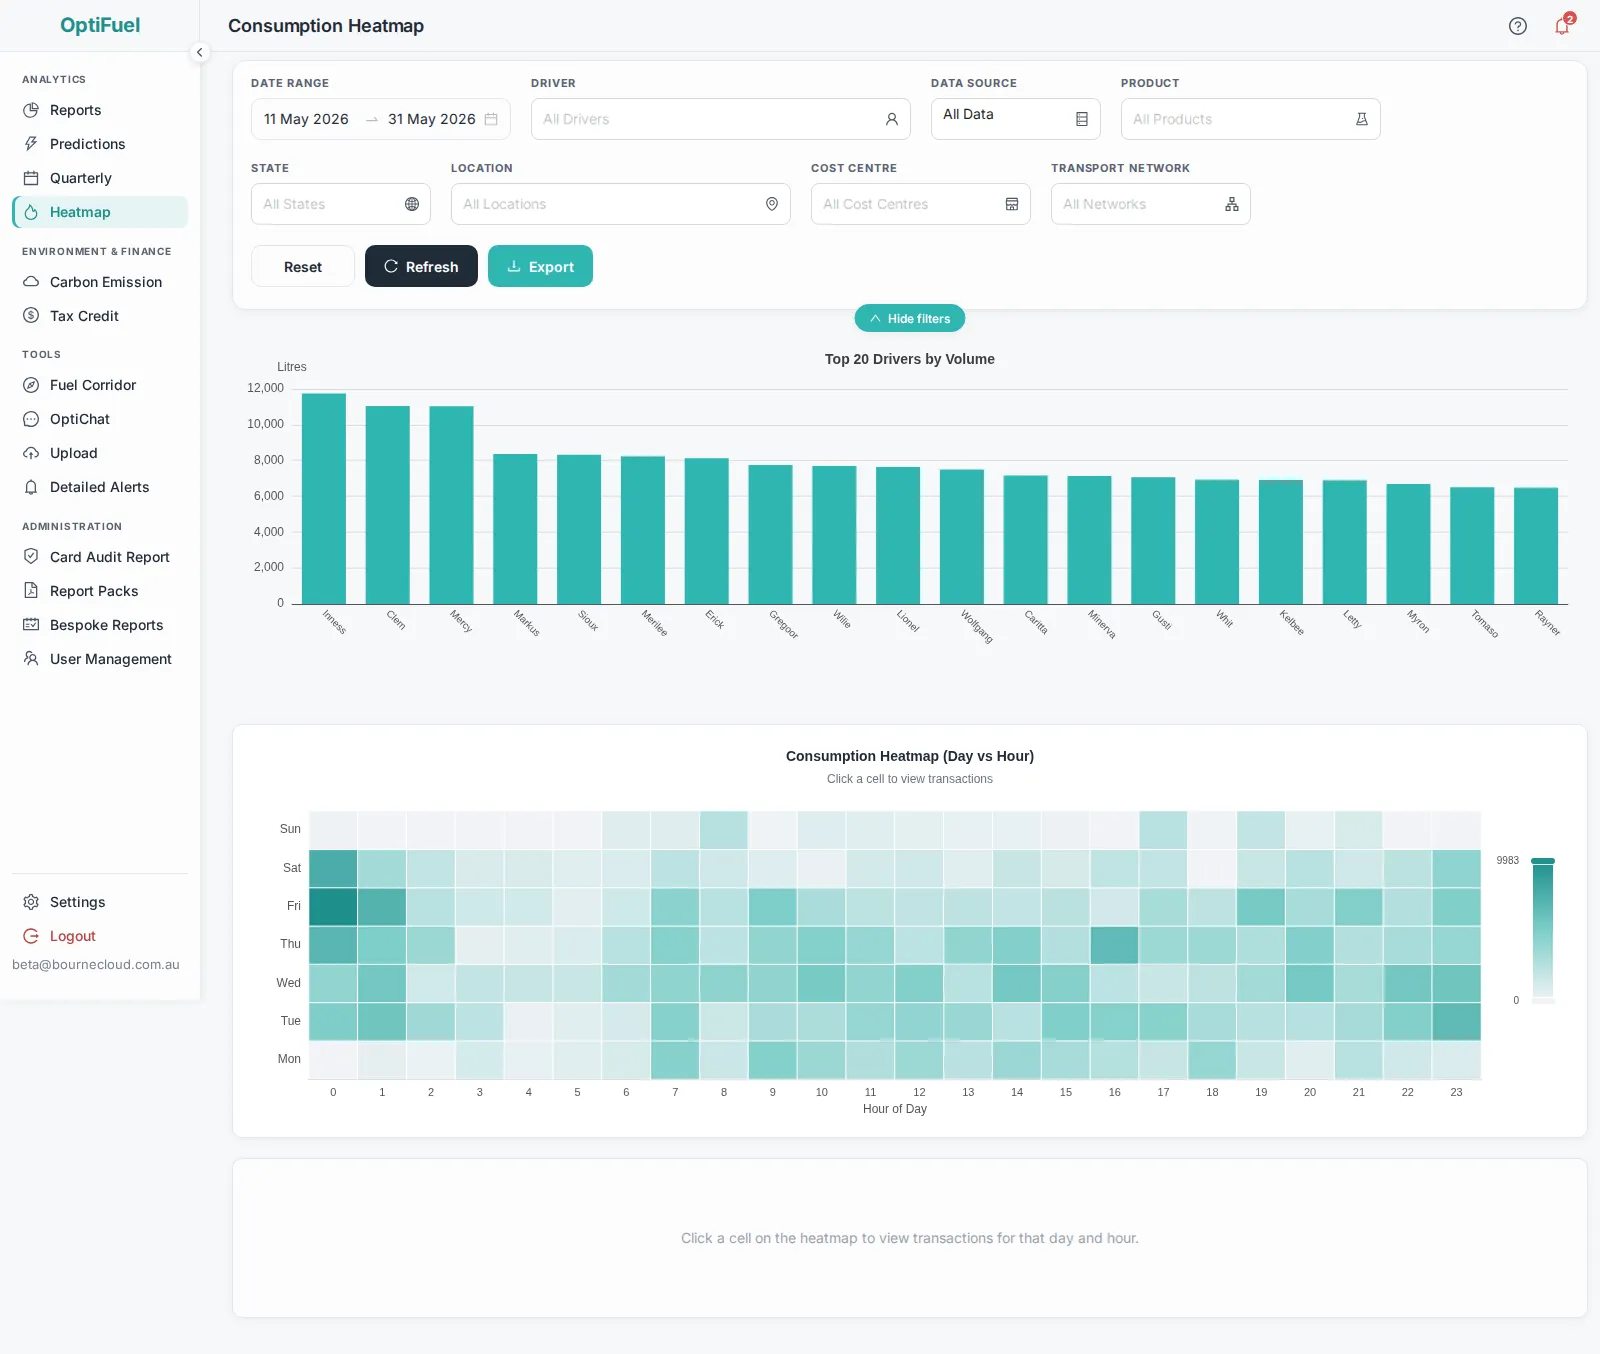
Find the locations driving consumption.
Rank locations by fuel consumption and compare the mix of fuel products across sites.
The Top 20 view helps teams quickly identify the locations responsible for the largest share of fuel usage and focus investigation where it matters most.
This same reporting environment can be filtered by date, driver, state, cost centre, product and network.
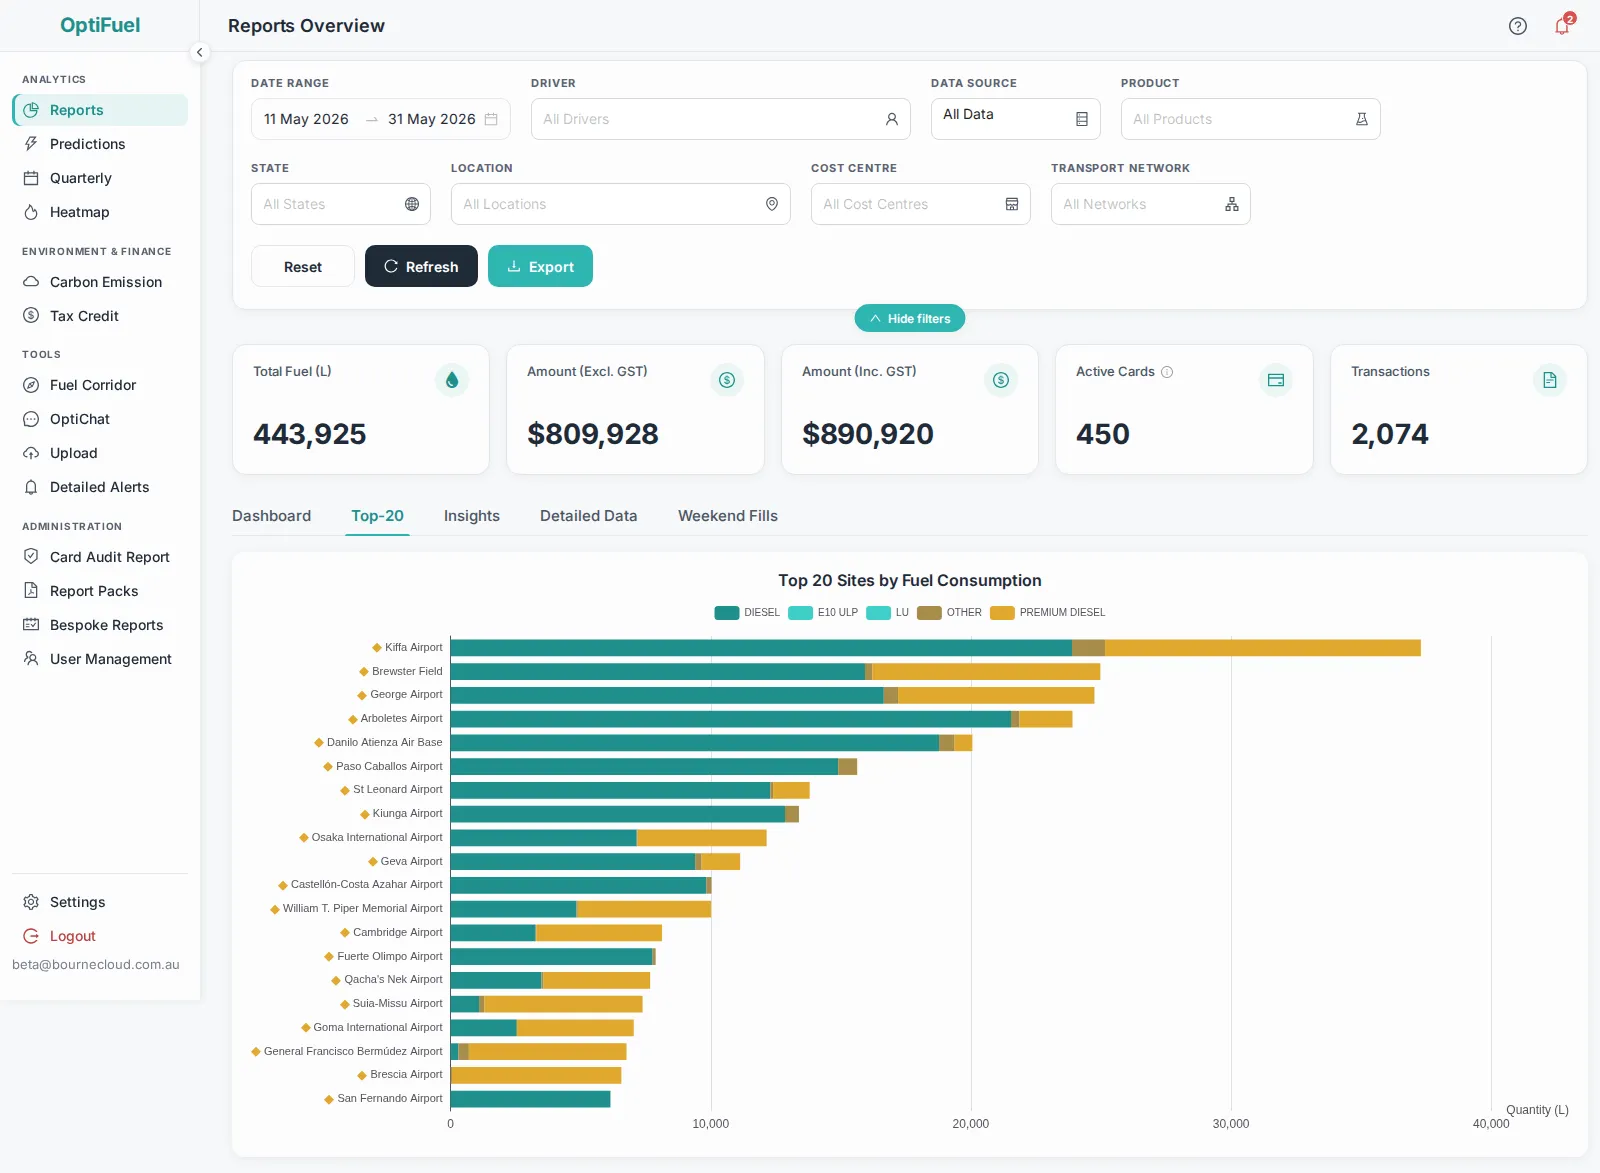
See when fuel activity is happening.
Fuel consumption is not only about how much is used. Timing can reveal important operational patterns.
OptiFuel combines driver volume analysis with a day and hour heatmap so teams can identify concentration periods, unusual timing and activity that deserves closer investigation.
Users can move from the heatmap into the underlying transactions for further review.
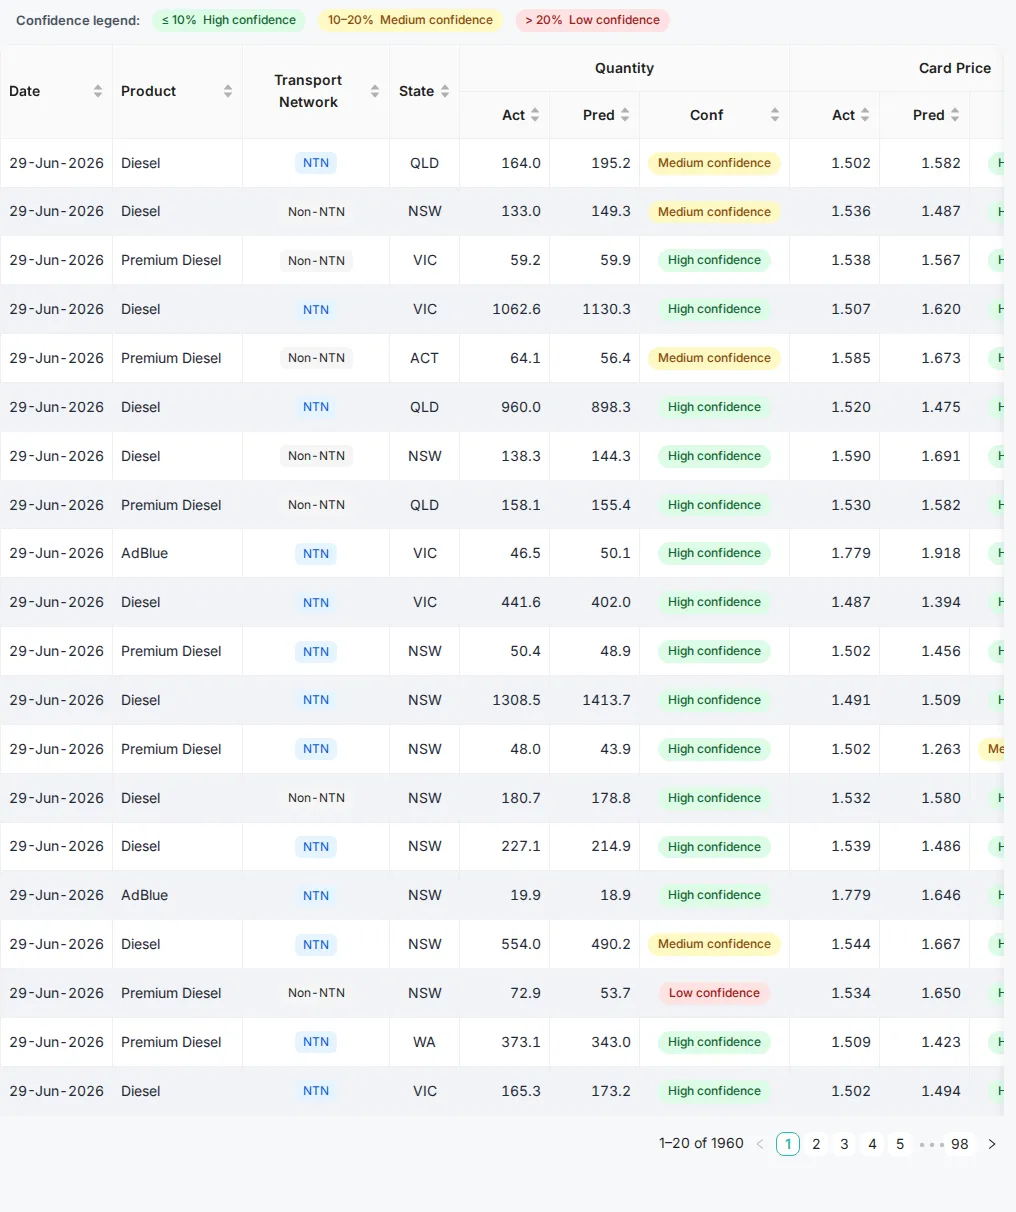
Use historical data to look ahead.
OptiFuel includes forecasting capability to help teams move beyond reporting what has already happened.
Historical fuel data can be used to generate future consumption forecasts across relevant operational dimensions, giving teams another input into planning and fuel management decisions.
The purpose is not to replace operational judgement. It gives planners a data based view of what future demand may look like.
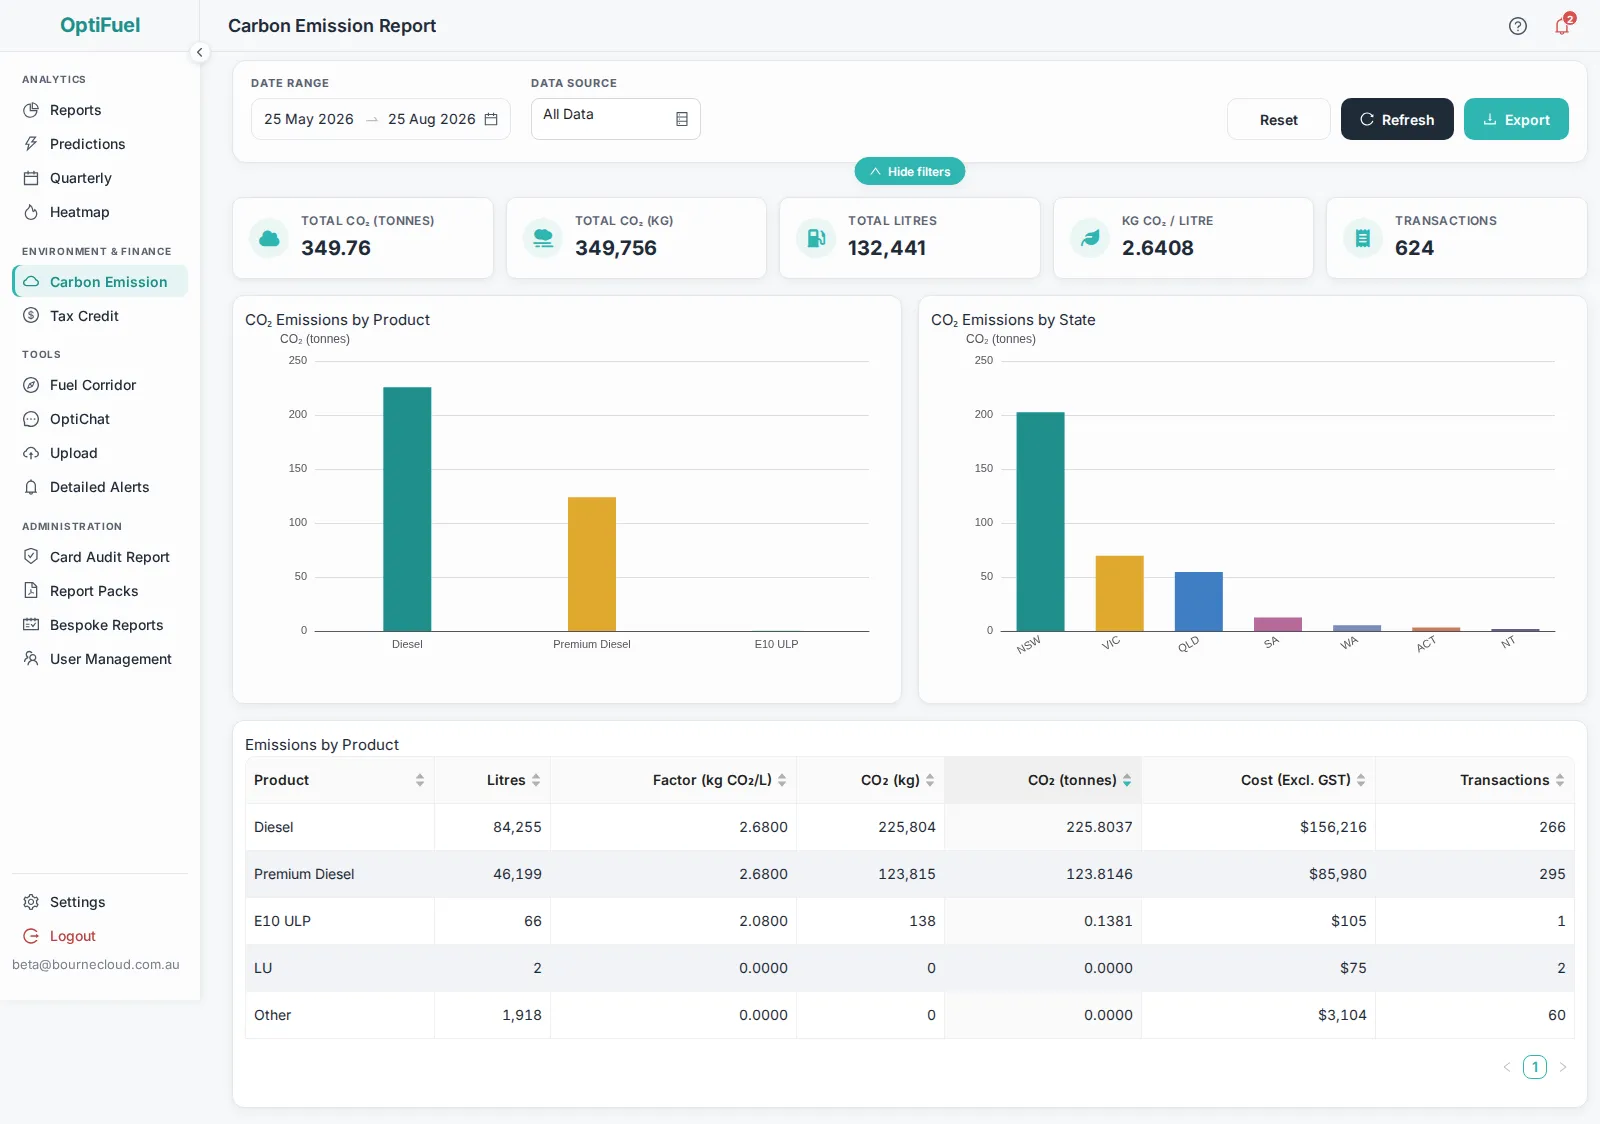
Measure the emissions behind fuel consumption.
OptiFuel converts fuel activity into carbon reporting so organisations can understand emissions alongside operational fuel performance.
Users can review total CO₂, emissions by fuel product, emissions by state, fuel volume and the underlying transactions used in the calculation.
This keeps environmental reporting connected to the same operational data used elsewhere in the platform.
- CO₂ reporting
- Product comparison
- State comparison
- Transaction detail
- Export
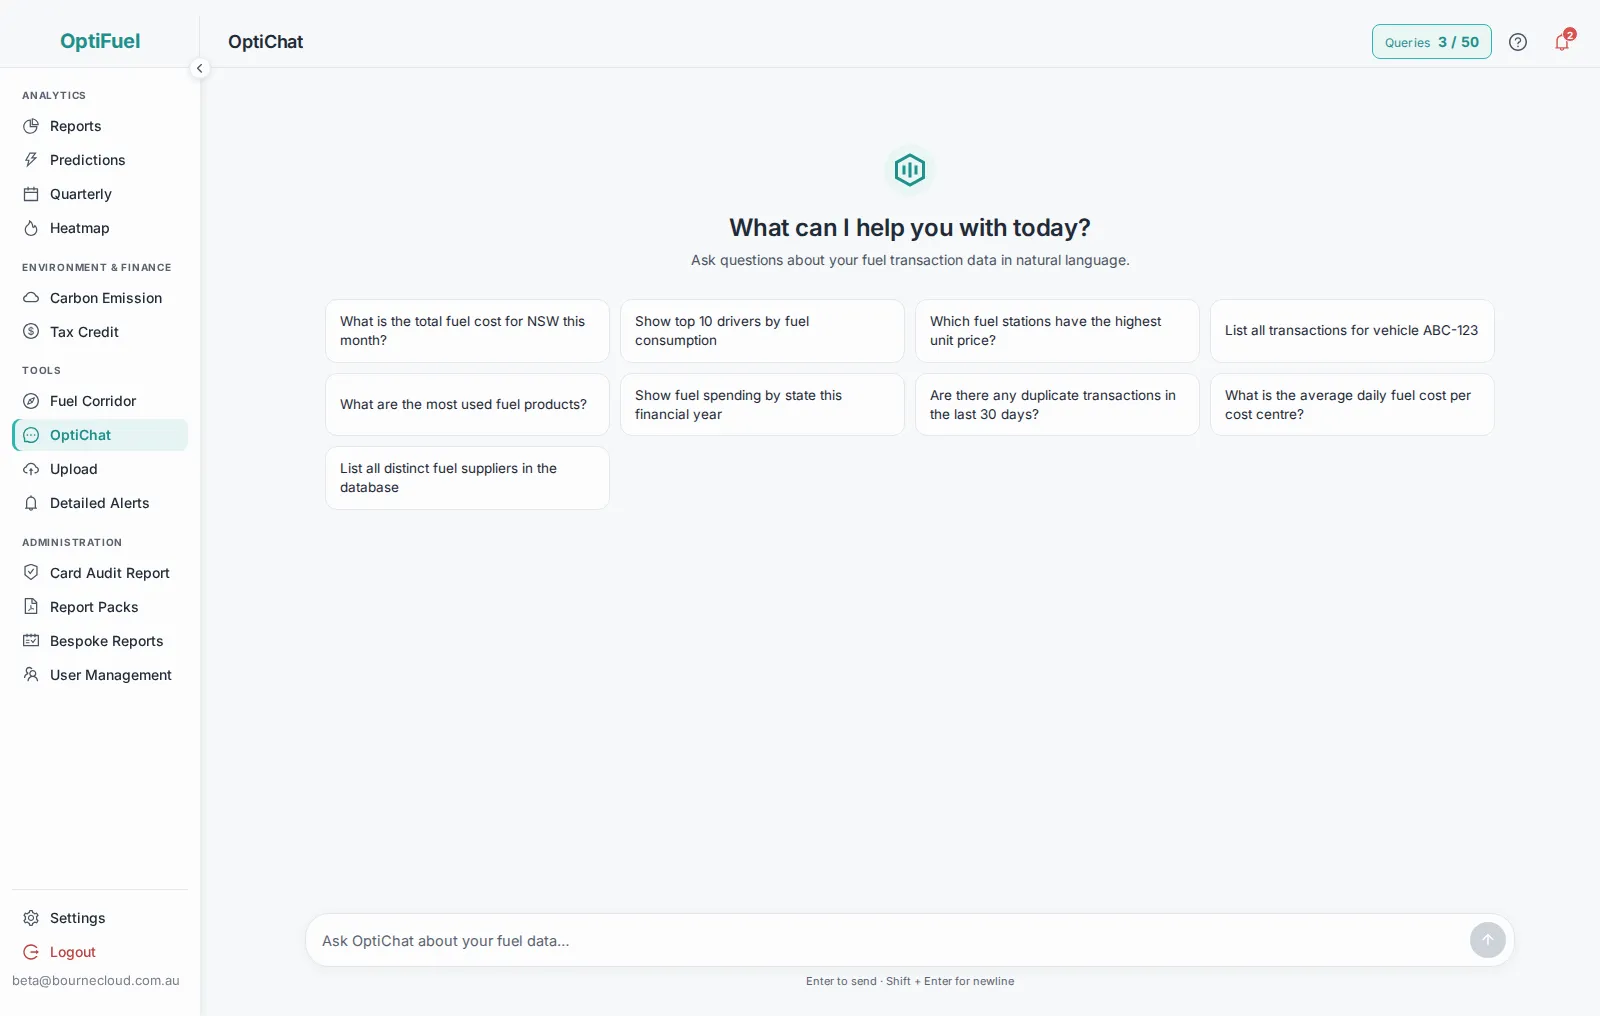
Ask questions about the data.
OptiChat gives users another way to explore fuel information.
Instead of relying only on predefined dashboards, users can ask natural language questions about fuel cost, drivers, locations, products, suppliers, transactions and other operational data.
It makes detailed information easier to access for users who know the business question they want answered but do not necessarily know which report to open.
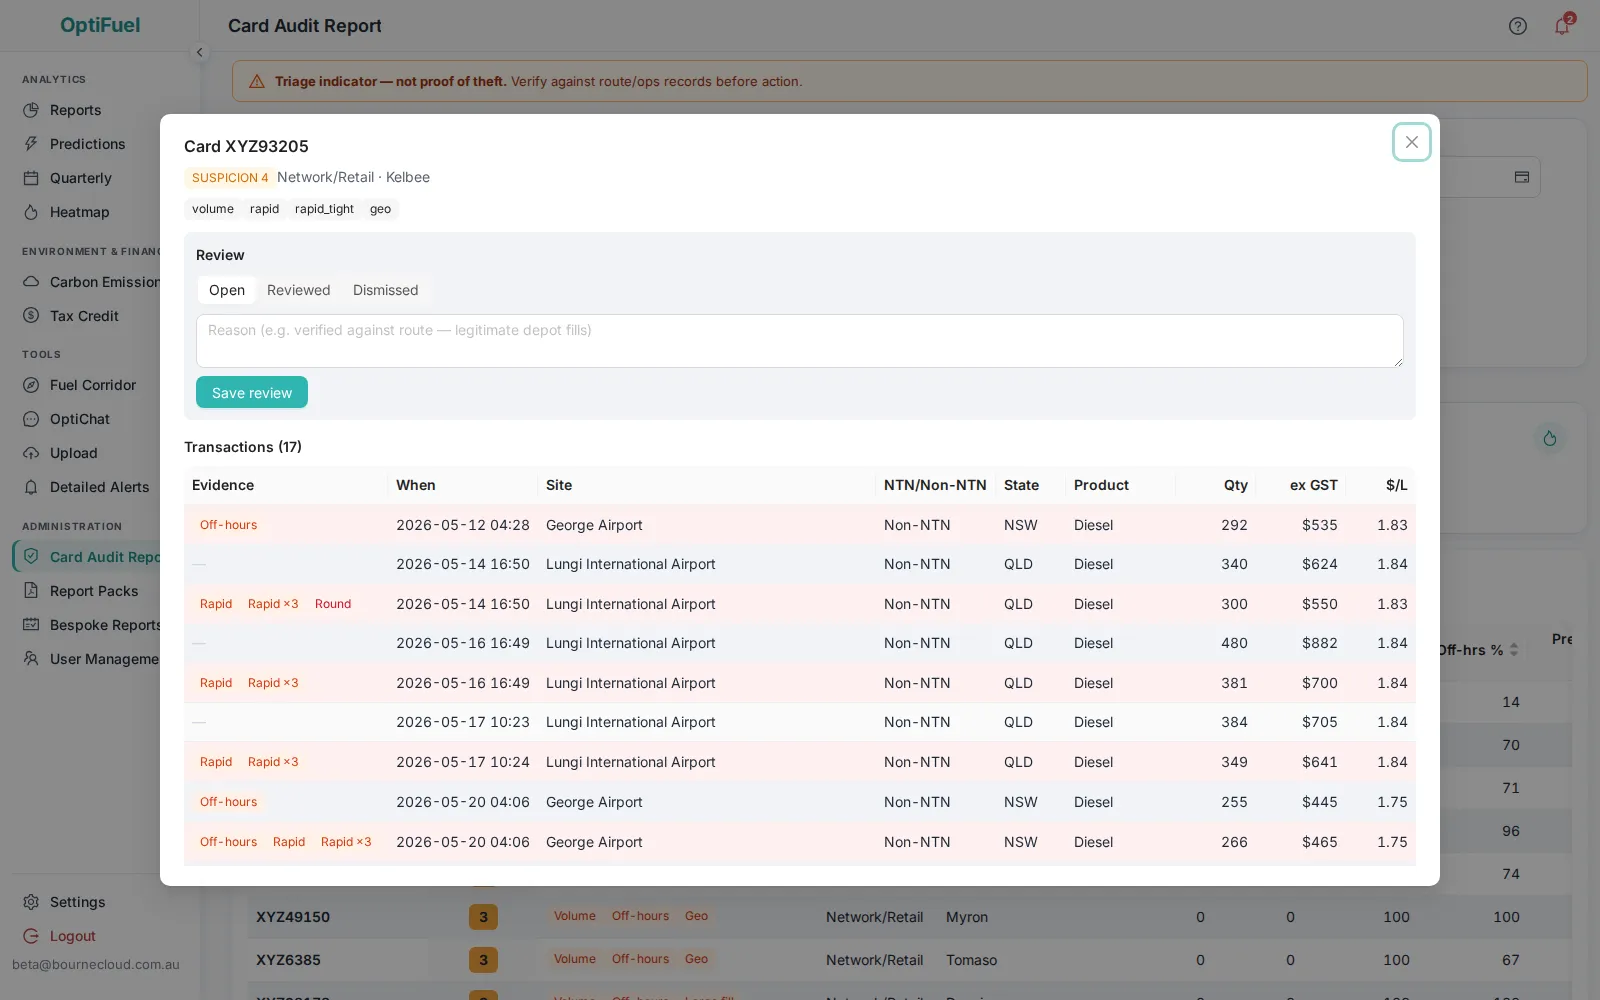
Surface activity that deserves a closer look.
The Card Audit Report applies a set of transparent checks to fuel card activity and brings suspicious patterns together for review.
Users can inspect the transactions behind an alert, understand which checks were triggered and record whether the activity has been reviewed or dismissed.
The purpose is to support investigation and triage, not automatically label activity as fraud.
More than dashboards.
Detailed alerts
Bring operational exceptions into a dedicated view so teams can investigate issues without manually reviewing every transaction.
Scheduled reporting
Create recurring reports for operational teams and stakeholders using defined reporting periods and delivery schedules.
Card audit controls
Apply consistent checks across fuel card activity and maintain a review trail.
Detailed exports
Move from high level reporting into transaction level data when deeper analysis is required.
Data upload
Bring new fuel transaction data into the platform through the supported ingestion process.
User access
Control access to platform functions and operational data based on user requirements.
Want to see OptiFuel with your fuel data in mind?
We can walk you through the platform, the data it uses and the operational problems it is designed to solve.